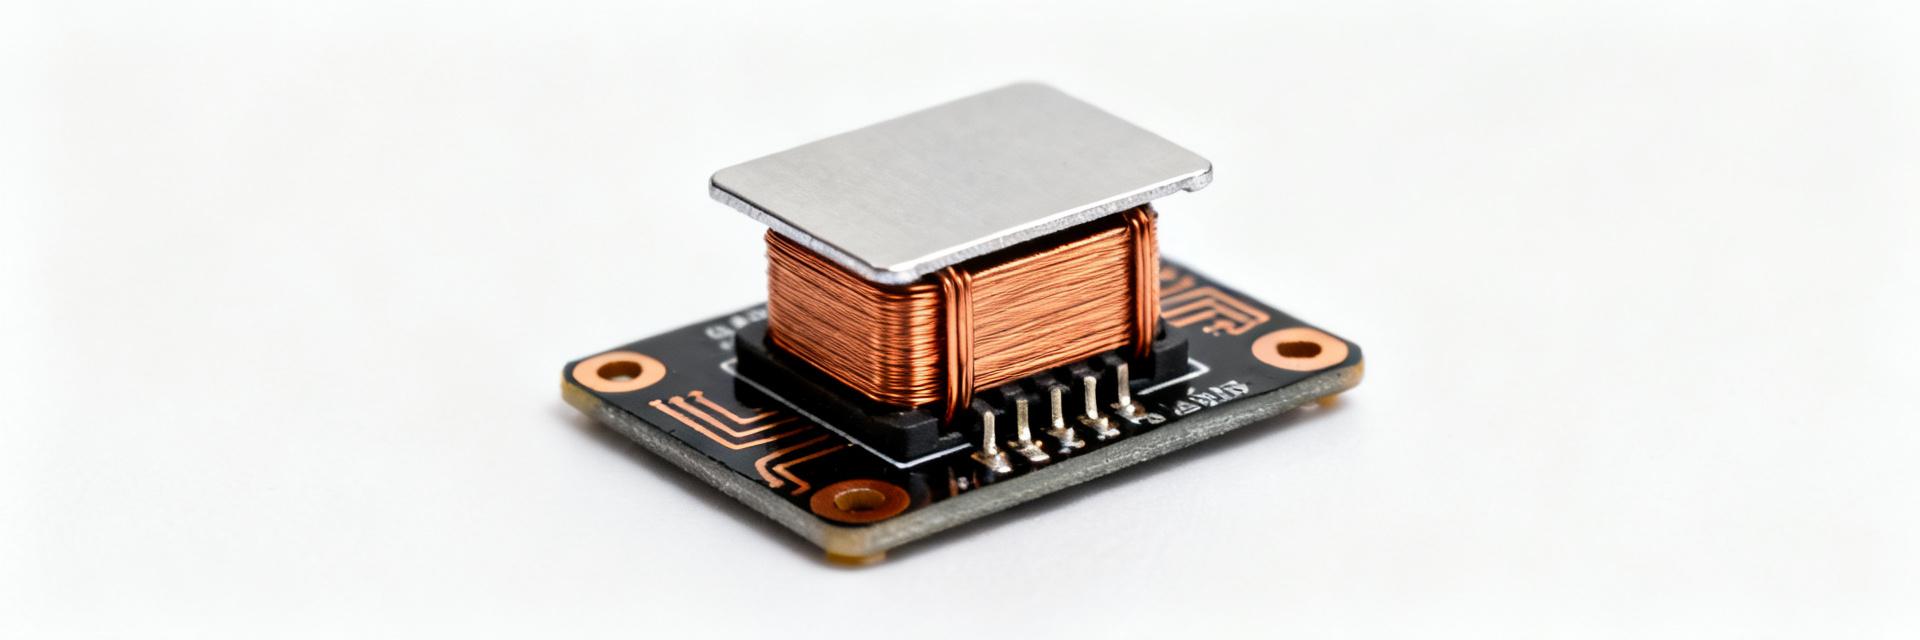
Bench measurements across multiple 6.8µH SMD power inductors show that small differences in DC resistance (DCR) produce measurable efficiency loss and thermal rise on low-voltage rails. This article compiles aggregated measured benchmarks (inductance, tolerance, DCR, Isat, Irms), explains practical test methods, and supplies a concise checklist so design engineers can choose and verify the right component for a given converter topology.
Overview: what a 6.8µH SMD power inductor is and where it's used
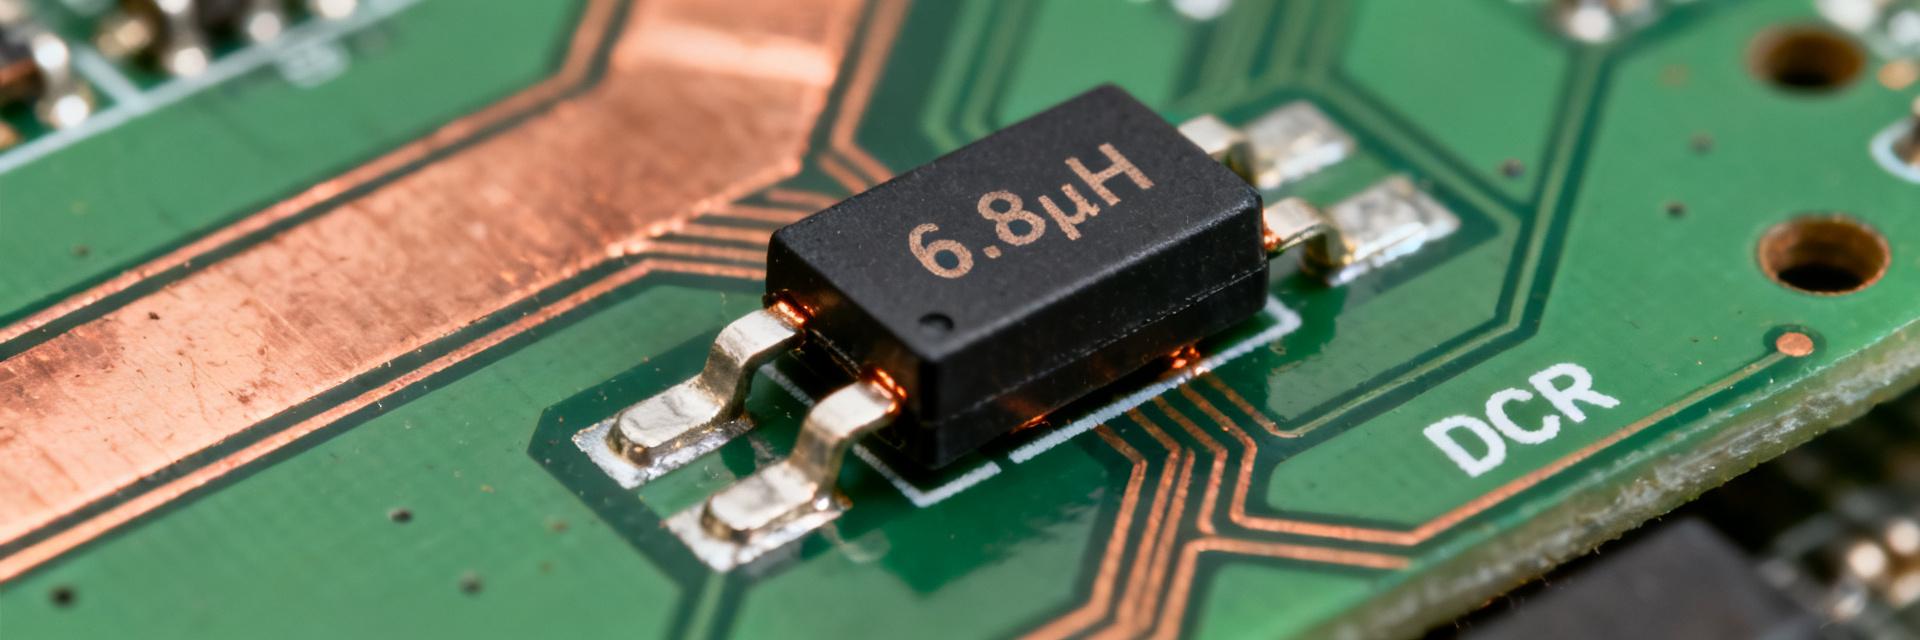
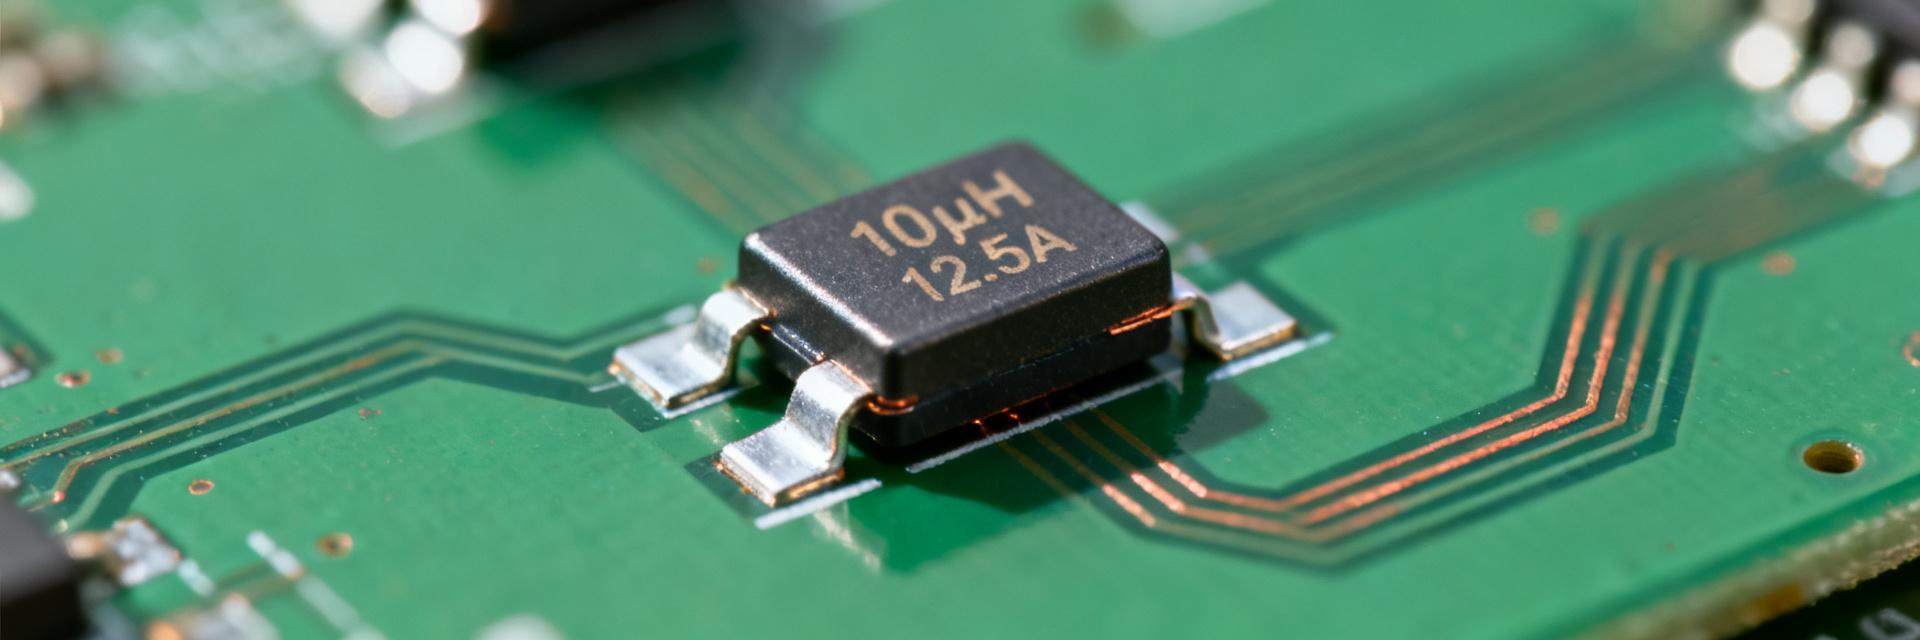
Point: A 6.8µH SMD power inductor is a surface-mount magnetic component sized for switch-mode converters and filtering in compact power rails. Evidence: Typical applications include buck/boost converters for point-of-load regulation, post-regulation filters, and input EMI suppression. Explanation: The nominal 6.8µH value balances energy storage with size; designers expect the part to behave predictably under DC bias and switching ripple to avoid efficiency or regulation drift.
Key electrical specs to expect
Point: Datasheets list inductance (6.8µH nominal), tolerance, DCR, Isat, Irms, and SRF. Evidence: Measured inductance under no-bias often falls within ±10–20% of nominal; DCR values range widely by package and core. Explanation: Inductance affects ripple and loop response; DCR governs conduction loss (I²R), Isat defines linear range before inductance collapses, Irms limits heating under ripple—each must be verified for converter operating points.
Common SMD packages and construction trade-offs
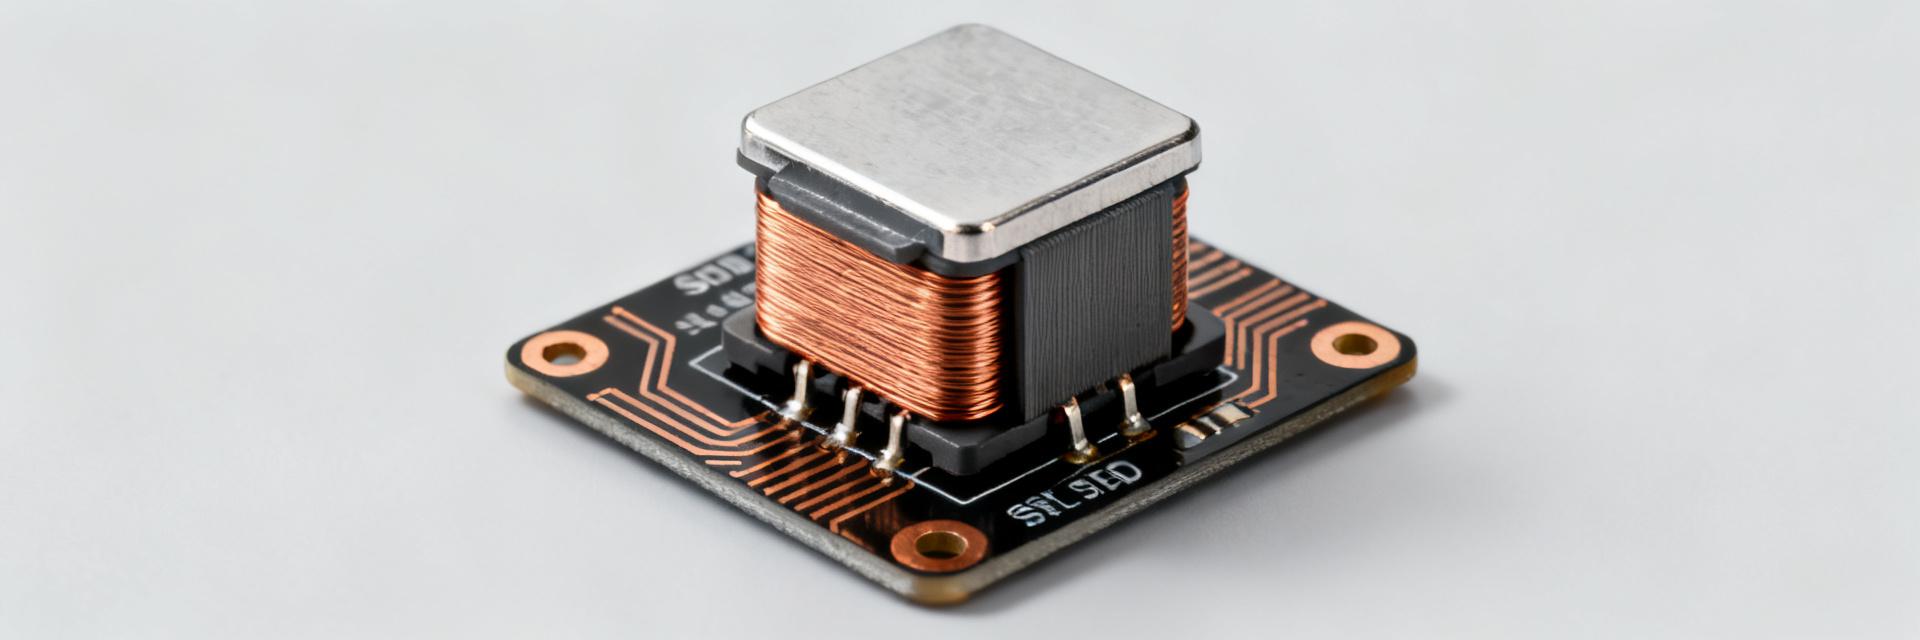
Point: Package and core choices trade off DCR, saturation, and thermal performance. Evidence: Shielded low‑profile ferrite parts give compact EMI control but higher DCR; larger powdered‑iron or open constructions reduce DCR and raise Isat. Explanation: For high-current low-voltage rails, prioritize constructions with lower DCR and a thermal path; for high-frequency, prioritize lower core loss and SRF even if DCR is modestly higher.
Measured spec benchmarks: inductance, DCR, Isat and Irms
Point: Aggregated measurements give realistic spec ranges versus datasheet claims. Evidence: Across sampled 6.8µH SMD units, no-bias inductance mean ~6.8µH (min 5.5µH, max 8.4µH), tolerance distribution clustered ±10–20%; DC bias curves show 10–50% drop at rated Isat. Explanation: Use mean/min/max to set derating and reserve margin in converter design; assume inductance falls under realistic bias and validate with bench curves.
Typical inductance and tolerance measurement results
Point: Report inductance both at zero bias and across DC bias points. Evidence: Recommended presentation: mean, min/max and percent tolerance at 0 A, 50% rated current, and near Isat. Explanation: A simple table or plot of inductance versus DC bias quickly communicates usable inductance for loop compensation and ripple prediction.
DCR: measured ranges and the direct impact on conduction losses
Point: DCR drives I²R losses and temperature rise. Evidence: Measured DCR commonly spans 5–80 mΩ for typical 6.8µH SMD power parts; conduction loss examples: at 10 A, a 10 mΩ part dissipates 1.0 W, a 50 mΩ part dissipates 5.0 W. Explanation: Always report DCR at 25°C and estimate at operating temperature (use temperature coefficient) to predict steady-state loss and thermal mitigation needs.
| DCR (mΩ @25°C) | Representative Current (I) | I²R Loss (W) |
|---|---|---|
| 10 | 5 A | 0.25 |
| 10 | 10 A | 1.00 |
| 50 | 10 A | 5.00 |
Test methodology: how to measure specs and DCR accurately
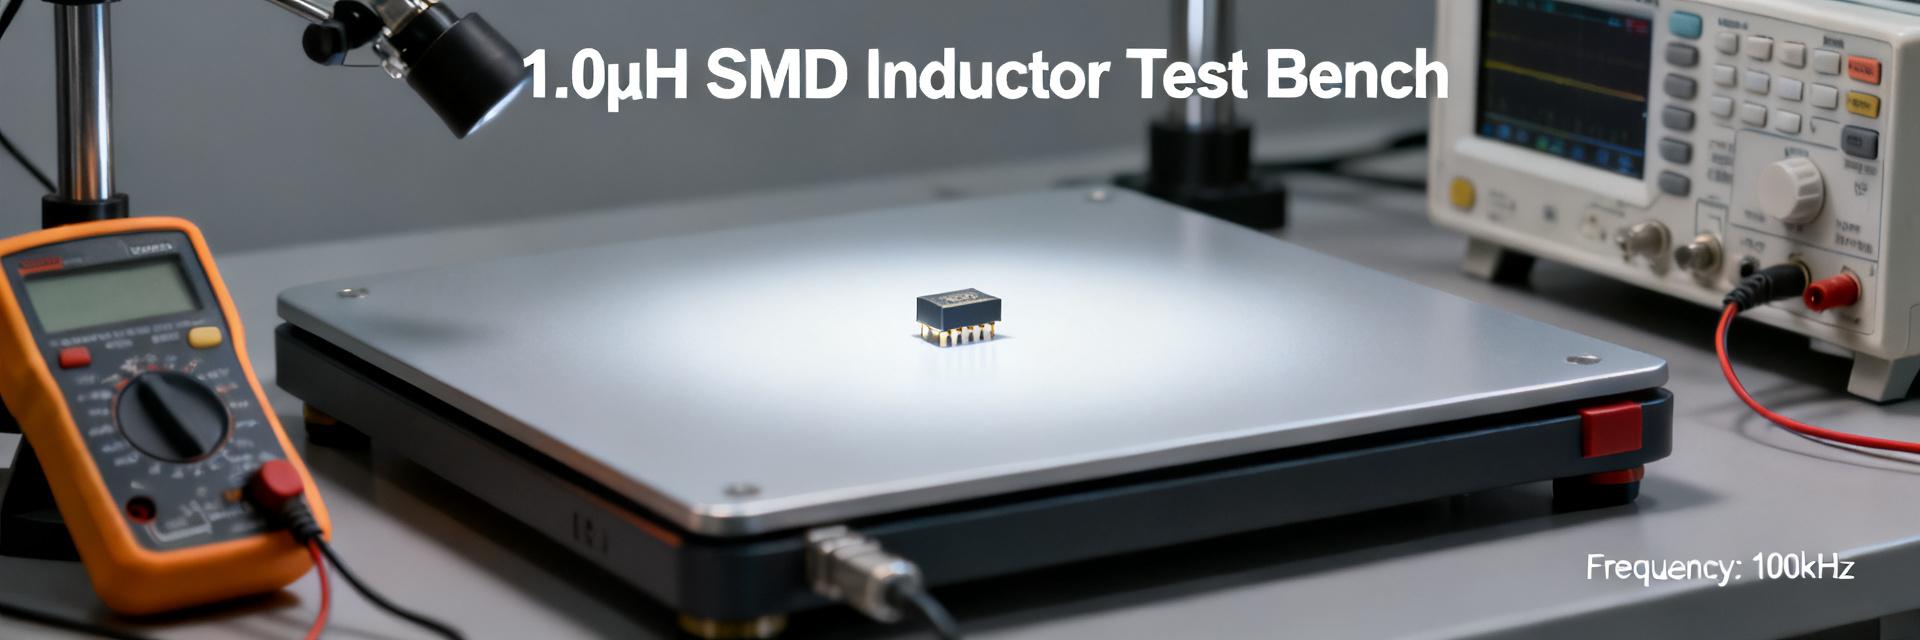
Point: Accurate characterization requires controlled instruments and fixtures. Evidence: Use a four‑wire LCR meter for low‑frequency inductance and DCR, a precision DC current source for bias curves, and a thermal fixture or chamber for temperature mapping. Explanation: PCB-mounted measurements with representative copper and vias produce results closest to in-system behavior; avoid clip leads that add series resistance and error.
Recommended bench setup and instruments
Point: Specify instruments and mounting practices. Evidence: Preferred kit: 4‑wire LCR meter, Kelvin‑sense fixtures, precision DC supply with pulsed capability, thermal plate, and calibrated thermocouple. Explanation: Test at multiple frequencies (e.g., 100 kHz, 1 MHz) and DC bias points; record measurement uncertainty and fixture correction to ensure repeatability between lots.
DCR measurement procedure under DC bias and temperature
Point: Measure DCR with attention to heating and calibration. Evidence: Procedure: zero‑offset calibration, Kelvin connections on PCB footprint, apply DC bias in short pulse to determine DCR without self‑heating, allow stabilized measurement for steady‑state thermal DCR, and report uncertainty. Explanation: Pulsed methods reveal cold DCR; sustained currents show operating DCR—both are needed for accurate loss modeling.
Performance trade-offs: DCR vs. size, saturation, switching frequency and efficiency
Point: Size and core affect DCR and Isat. Evidence: Smaller, low‑profile parts often show higher DCR and lower Isat; larger parts or different core materials lower DCR but increase footprint. Explanation: For tight, high‑current rails, accept larger footprint or parallel devices; for high switching frequency, prioritize SRF and core loss even if DCR is midrange.
How package size and core material drive DCR and Isat
Point: Correlate geometry to electrical limits. Evidence: Ferrite cores give higher permeability and lower losses at many switch frequencies but may saturate earlier; powdered cores handle DC bias better at cost of higher core loss vs frequency. Explanation: Match core material to operating frequency and DC bias; consider thermal dissipation path when comparing DCR across packages.
When to prioritize low DCR vs. other specs
Point: Decision rules simplify selection. Evidence: For low‑voltage rails where conduction loss dominates, prioritize minimal DCR and thermal path; for high‑frequency converters, prioritize SRF and low core loss. Explanation: Set acceptance thresholds (e.g., DCR ≤ X mΩ at operating temp) and require vendor bias curves plus your bench-verified DCR for procurement.
Practical selection checklist & bench tips for engineers
Point: Use a short verified checklist in procurement and validation. Evidence: Include measured DCR at 25°C and operating temp, inductance-versus-bias curve, defined Isat/Irms criteria, recommended PCB footprint, and lot sampling plan. Explanation: A spec sheet entry that mandates bench validation eliminates surprises in production and ensures converters meet efficiency and thermal targets.
Specification checklist to request and verify
Point: Concrete items to request from suppliers and validate yourself. Evidence: Checklist: DCR (mΩ @25°C & operating temp), inductance at no-bias and specified DC bias points, Isat defined by X% drop, Irms and thermal rise at ripple, mounting footprint and torque. Explanation: For traceability, record measurement setup, fixture, and sample lot numbers; reference example part MPIA4020V3-6R8-R when creating pass/fail criteria.
PCB layout and mitigation tips for DCR-related issues
Point: Layout matters as much as component choice. Evidence: Minimize series copper resistance on critical nodes, use multiple vias for current and thermal relief, consider paralleled inductors or busbars for extreme current. Explanation: In-situ checks—thermal imaging, ripple current measurement, and IR drop scans—confirm that low DCR selections realize expected system-level efficiency gains.
Summary
Designers must treat the 6.8µH SMD power inductor as a specs-driven choice: verify inductance under bias, measure DCR at operating current and temperature, and apply the checklist and test methods above to prevent efficiency and thermal surprises. Bench validation yields the confidence needed for reliable low-voltage power rails.
- Measure DCR at 25°C and under expected operating temperature; report in mΩ and include uncertainty to predict I²R losses accurately for efficiency budget.
- Obtain inductance-versus-DC-bias curves and Isat definitions; use mean/min/max values to set derating and loop-compensation margins in converter design.
- Prefer package/core combinations that balance DCR, Isat, and thermal dissipation for your current and frequency profile; document layout and fixture used for repeatability.
Frequently Asked Questions
How do I verify a 6.8µH SMD power inductor's DCR in-system?
Use Kelvin-sensed measurements on the populated PCB, apply representative DC and ripple currents, and confirm with pulsed and steady-state methods. Thermal imaging during steady-state helps correlate DCR-derived losses to actual board temperature rise and validates cooling design.
What DCR should I target for a 6.8µH SMD power inductor on a 1V rail carrying 10A?
Target DCR below ~10 mΩ to keep conduction loss near 1 W at 10 A; include margin for elevated operating temperature and copper trace resistance. If lower DCR isn’t available, consider parallel inductors or bus redesign to reduce system series resistance.
Can I rely on datasheet DCR values for final design of a 6.8µH SMD power inductor?
Datasheet DCR is a starting point but may omit operating-temperature or fixture effects. Always validate the datasheet with your PCB mounting, measure DCR under expected current and temperature, and require supplier bias curves to ensure field performance.
How does core material selection impact the AC vs. DC loss profile of a 6.8µH inductor?
Ferrite cores offer lower core losses at higher switching frequencies but drop sharply at saturation. Powdered iron and composite alloys have higher core losses but exhibit a soft saturation curve, making them superior for high DC bias conditions despite marginally higher nominal DCR.