Background & Part Overview

Part electrical and thermal summary
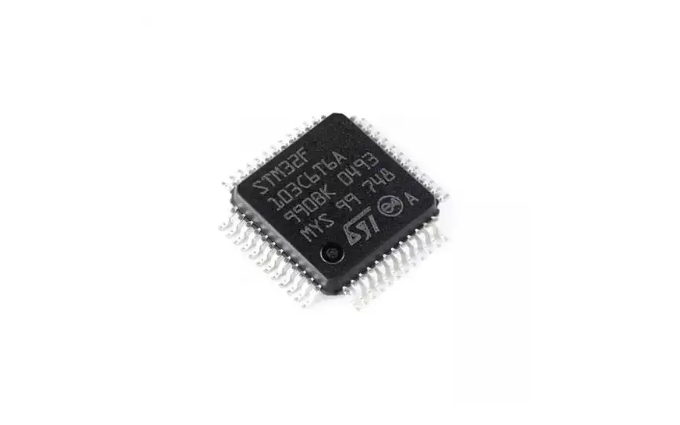
Point: The device is a 0606-ish package resistor-style power element with a nominal resistance value near 3.3 mΩ and rated working voltage per the family.
Evidence: Datasheet lists nominal R, rated power, and thermal path through top copper and bottom pad.
Explanation: Key datasheet values targeted for validation are RDC (ohms), Vdrop at high current, and packaged thermal paths (top-surface conduction and bottom pad to PCB). Package land pattern and exposed pad size strongly affect RθJA and board-level heating.
Why measured thermal data and high current testing matter
Point: Datasheet Rθ and package thermal specs are baseline but do not capture board-level variables that drive failure modes.
Evidence: In practice, overheating and derating occur when PCB copper, vias, and TI interfaces are insufficient.
Explanation: Measured thermal data show real ΔT vs. I and reveal nonlinearities, enabling continuous-current translation, derating curves, and reliability margins to be defined for the actual assembly rather than relying solely on bench datasheet numbers.
Test Setup & Measurement Methodology
Test rig, instrumentation & calibration
Accurate characterization requires precision sources and calibrated thermal sensors. Recommended instruments include a precision current source (±0.1% or better), 4-wire voltage measurement, type‑T thermocouples or 4‑wire RTDs on the package surface, and an IR camera for mapping.
Pro Tip: Place thermocouples directly on the package surface at consistent locations, use thin thermal interface material where appropriate, and log at ≥1 Hz for steady-state capture.
Test protocols, conditions & reporting format
Define steady-state and pulsed regimes, ambient control, and reporting units. Use controlled ambient (23–25°C), DUT mounted to representative PCB, current sweeps in defined steps (e.g., 0.5–1 A increments), and soak until ΔT change
Report I, Vdrop, power (I²R or I×Vdrop), Tsurface/Tjunction estimates, ΔT, and derived Rθ values in clear SI/US unit pairs.
Measured Thermal Results (steady-state & transient)
Steady-state temperature rise vs. current
Plot ΔT (surface minus ambient) against current to extract slope-derived RθJA. Linear regions allow RθJA = ΔT / Pdiss where Pdiss is measured power; nonlinear rise at high dissipation indicates spreading limits.
Figure: DeltaT vs I Visualization (Conceptual Trend)
Transient response and time constants
Short-pulse heating reveals thermal capacitance and τ (time constant). Record rise/decay curves for pulses (e.g., 100 ms–10 s) and fit to single- or dual‑exponential models to extract τ.
Measured Current Handling & Electrical Performance
Voltage drop & power dissipation trends
Vdrop vs. I is near‑ohmic at modest currents but can shift with temperature. Measured Vdrop = I×Rmeas where Rmeas rises slightly with temperature. Plot Vdrop vs. I and overlay predicted temperature using steady-state Rθ to verify margin at design currents.
Observed limits & failure modes
Watch for thermal runaway indicators and mechanical stress at high current. Typical signs include accelerating ΔT for small I increases, rising contact resistance, and solder‑fillet heating. Capture diagnostic logs to define shutdown or derating thresholds.
Design Implications & PCB Integration Guidance
Thermal management strategies for AMELH6060S-3R3MT
PCB copper and vias dominate board-level thermal performance. Increasing top/bottom copper area and adding thermal vias reduces ΔT per watt. Use thermal pad with multiple vias to internal planes; doubling top copper area typically reduces ΔT by ~20–30%.
Application Example & Actionable Checklist
Example design calculation
For a 8 A target with measured Rmeas = 3.5 mΩ:
Pdiss = I²R = 8² × 0.0035 = 0.224 W
With measured RθJA ≈ 143°C/W, ΔT ≈ 32°C
Tjunction = Tamb + 32°C.
If Tamb = 25°C and Tj,max = 125°C, margin is ample.
Pre-production verification checklist
- Re-run steady-state test on final assembled board
- IR imaging of hotspots under full load
- Solder fillet temperature inspection
- Worst-case Vdrop measurement
- Final sign-off by thermal and reliability engineers